Most retrospectives run on memory. Someone opens the board, someone else says "that sprint felt rough," and the conversation drifts to whichever incident is freshest in everyone's mind. If a chart shows up at all, it is often a burndown pulled together the night before from a spreadsheet nobody has touched since the sprint before last. None of that is anyone's fault: pulling real, current numbers out of Azure DevOps by hand, for one specific sprint, is genuinely tedious. This is a walkthrough of doing the same retro with numbers read directly from your own organization, for the sprint you are actually retro-ing, with nothing typed in by hand.
Pick the sprint, not a dashboard
A running dashboard is the wrong shape for a retro. You want one finished sprint, looked at on its own, compared to the sprint before it: not a rolling trend line that blurs six sprints together. Agile Gauge's Retro Snapshot view is built around exactly that: you pick a team (or a team set spanning several teams and even several projects, configured once), pick one finished sprint, and the whole screen is scoped to that sprint and the one before it. There is no setup beyond the initial team-set pick: the numbers are read live from Azure DevOps when you open the screen.
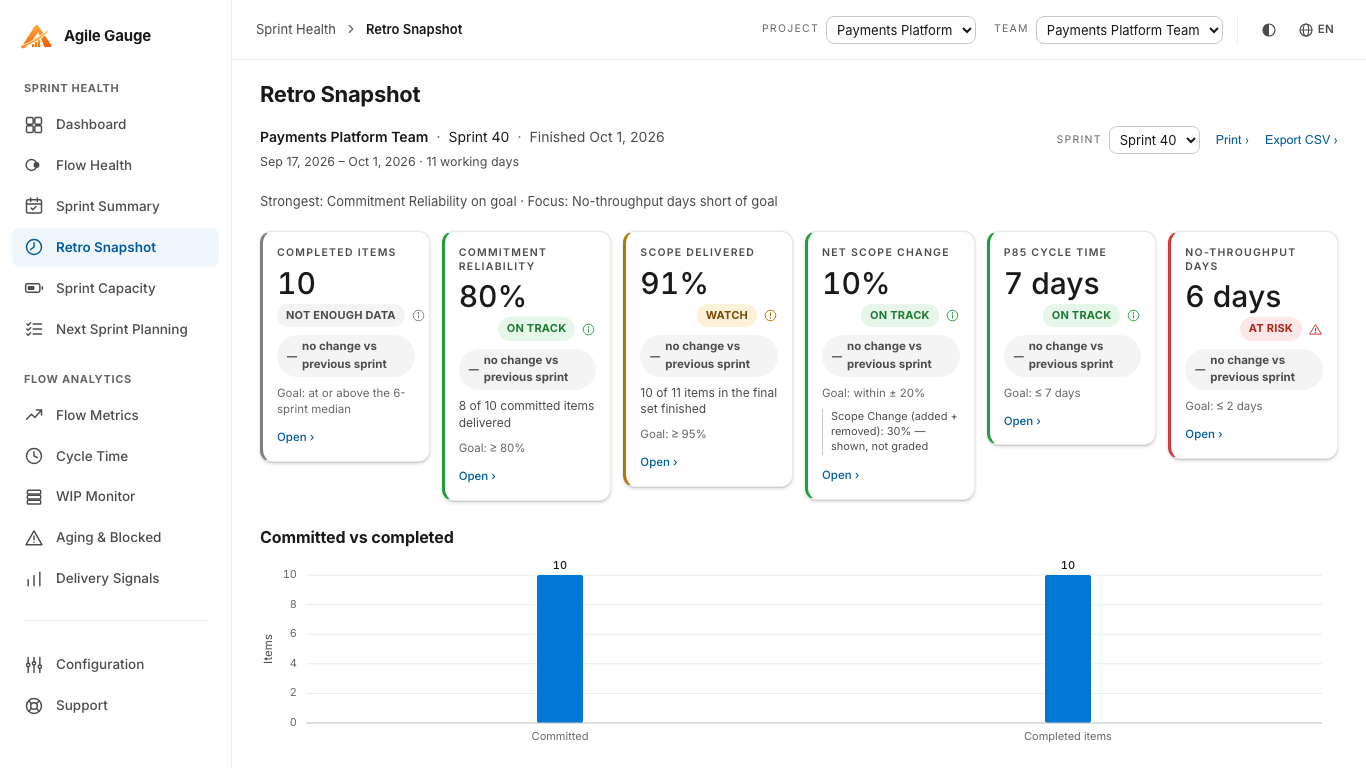
Six numbers worth putting in front of the team
Retro Snapshot leads with six KPIs, each graded against a goal and each showing its delta against the previous sprint:
- Throughput: how many items the team actually finished.
- Sprint Commitment Completion: how much of what was planned at the start actually got delivered.
- Scope Delivered: how much of everything finished, planned or not, shipped this sprint.
- Net Scope Change: how much work was added or removed after the sprint started.
- P85 Cycle Time: the cycle time that 85% of finished items beat, a steadier read than an average that one slow item can drag around.
- No-Throughput Days: how many days went by with nothing finished at all.
The goals behind each of these are not fixed defaults you have to accept: a "Goals" panel on the related Flow Health view lets you set your own number per KPI, per team set, and Retro Snapshot grades against those same goals. If you have never touched them, the screen says so plainly rather than pretending a shipped default is a target your team agreed to.
Underneath the six numbers, a narrative band pulls out a "what to celebrate" and a "where to focus next" line, generated from rules applied to those same six numbers: not a separate opinion layered on top, and not a personality judgment about the team. It is a starting sentence for the conversation, not the conclusion of it.
When someone doubts a number, open it
Every retro has a moment where someone says "that doesn't sound right." In Retro Snapshot, that moment is short: each of the six KPIs opens the exact work items behind it: the same item panel used across the rest of the hub. If Throughput looks low, click it and see the list of what did and did not count, with the ability to jump straight into any one of those items in Azure DevOps. Scope Delivered opens two separate lists for what was added and what was removed, each with its own count, so "our scope moved a lot" turns into an actual list you can scroll during the meeting instead of a number people have to take on faith.
A distribution, not just an average
Alongside the six KPIs, the screen includes a cycle-time distribution chart for the sprint, so the conversation about "were we consistent" has something to point at beyond the single P85 figure. A team that finishes most items quickly but drags a handful out for weeks looks very different from a team whose items are all clustered close together: even if their averages land in the same place. Seeing the shape of the sprint, not just one summary number, is usually what turns "cycle time was fine" into a specific, useful observation.
Print it for the room
Not every retro happens with everyone staring at the same screen. Retro Snapshot has a print layout built for handing around a room: it always prints in light colors even if you are using the dark theme, opens with the team name, the sprint, its dates, and the date it was printed, and every page carries a footer with page numbers. All five item lists print together, charts are sized to fit the page, and nothing, a tile, a row, a chart, gets cut across a page break. A typical sprint's worth of Retro Snapshot fits on about three printed pages instead of the seven it would have taken before this was built for printing specifically.
Running this for real
If your organization already has more than one team you retro separately, you can keep several named team sets, up to twenty, each with its own teams and its own goals, and switch between them from a "Saved set" menu next to the team picker. Retro Snapshot remembers which one you used last, and if you had already saved a team set before this existed, it shows up automatically as your first named set with its teams and goals intact.
None of this replaces the conversation a retro is actually for. What it removes is the ten minutes at the start where someone tries to reconstruct what happened in the sprint from memory and a half-updated wiki page, and the moment later on where a number gets waved away because nobody can show their work. The data is already there in Azure DevOps: Retro Snapshot's job is just to put the right slice of it in front of the room.
Agile Gauge includes Retro Snapshot, Flow Health and nine other views for sprint health, flow analytics and portfolio reporting, all read directly from your own Azure DevOps organization. Start a 14-day trial: every feature unlocked, no card required.